The Tea Board of Kenya (TBK) has released its performance report for February 2025, shedding light on key shifts in the tea industry. From sharp declines in production due to severe weather, to improved auction performance and expansion into emerging export markets, the report reveals a sector under pressure but adapting with resilience.
Key Highlights – February 2025 Tea Sector Snapshot
- Tea production dropped by 13.5%, down 10.83 million kgs
- Auction absorption rate rose to 81%, up from 53% in 2024
- Exports reached 42.34 million kgs across 58 countries
- Specialty tea output hit 793,040 kgs, 2% of total volume
- Local consumption continued downward trend
Weather-Driven Production Decline
Tea production in February 2025 experienced a significant decline compared to the same month in 2024, falling by 13.49% from 55.44 million kilograms to 44.61 million kilograms. The main driver behind this drop was the hot and dry weather conditions that prevailed across most tea-growing regions. February is typically a warm month, but this year, rainfall was exceptionally low, particularly in areas East and West of the Rift Valley. Only a few isolated highland zones received marginal rainfall. This situation stood in sharp contrast to February 2024, when tea yields were boosted by the lingering effects of the El Niño weather phenomenon. The current weather strain has disrupted growth cycles, reduced leaf plucking frequencies, and stressed young tea bushes — all contributing to lower yields.
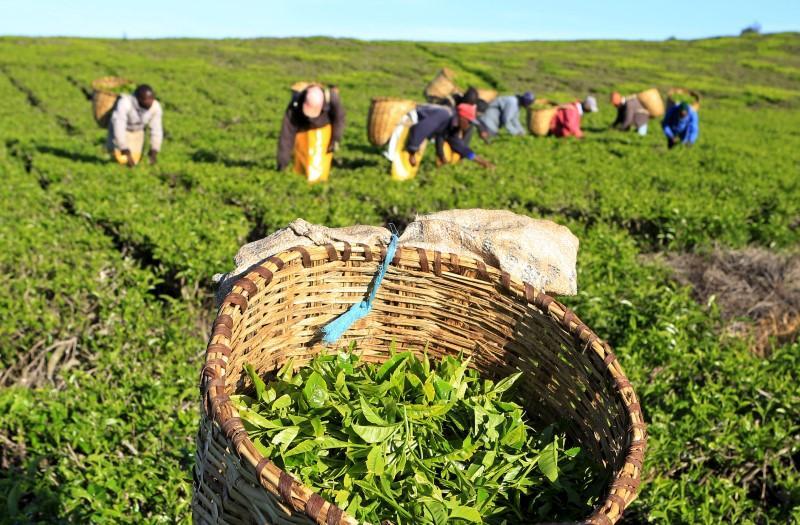
Regional Impact on Production
The decline in production was felt across all key tea zones, though some regions bore a heavier burden than others. In the East of the Rift, production fell by a staggering 21.2%, from 19.57 million kilograms to just 15.41 million kilograms. This region is typically drier and more sensitive to climatic variations, making it more vulnerable during prolonged dry spells. Meanwhile, the West of the Rift—which usually produces higher volumes—registered an 18.6% drop, from 35.87 million to 29.20 million kilograms. The worst-hit group was the smallholder tea farmers operating under the Kenya Tea Development Agency (KTDA). This group recorded a 24.1% drop in production, from 31.38 million to 23.81 million kilograms. In contrast, estate-managed plantations declined by 18.7%, while the Nyayo Tea Zones and independent factories fared slightly better with smaller percentage drops. These figures highlight the urgent need for climate-resilient farming strategies, such as water harvesting, mulching, and drought-resistant clones.
Production Comparison – February YoY (% Drop)
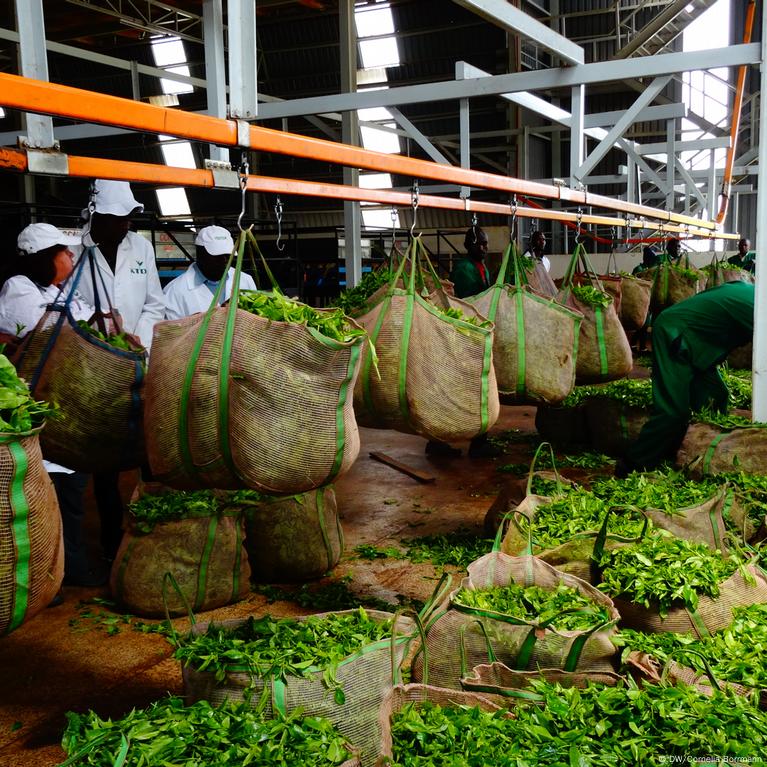
Specialty Teas: A Niche Market Rising
Out of the 44.61 million kilograms produced in February, 793,040 kilograms were classified as specialty teas. While still a small segment, accounting for just 2% of total production, this niche is gaining momentum. Specialty teas—particularly Orthodox teas, which made up 99% of the specialty output—offer opportunities for value addition and premium pricing in export markets. These teas are largely processed by plantation estates and private factories that have invested in specialized equipment and marketing strategies. Additionally, small quantities of green and purple teas were also produced, catering to health-conscious and gourmet consumers in Europe, Asia, and the Middle East. With growing global demand for differentiated tea products, Kenya’s investment in specialty teas presents a promising future.
Auction Dynamics: Resilient Demand Despite Global Challenges
February saw 35.89 million kilograms of tea sold through the Mombasa Auction, a figure higher than January's volume of 33.76 million kilograms, though slightly below February 2024’s volume of 39.11 million kilograms. Despite this, the auction performed strongly, with 81% of the tea on offer being absorbed by the market—a significant improvement from the 53% absorption rate recorded in the same period last year. The weighted average price for Kenyan tea rose to USD 2.25 per kilogram, up from USD 2.23 in February 2024 and USD 2.19 in January 2025. This price improvement, though marginal, reflects increased buyer interest and better quality grading. The best-performing teas were the CTC “leaf” and “dust” grades that displayed brighter liquors and consistent appearance. Lower-quality and secondary grades, as well as reprinted lots, attracted lower prices or failed to attract bids altogether, highlighting the importance of quality assurance at factory level.
Auction Insights – February 2025
Price vs Quality
Best-sorted CTC grades fetched top prices; plainer and secondary grades attracted fewer or no bids.
Smallholder Advantage
KTDA-managed factories achieved an average price of USD 2.65/kg, outperforming 2024 (USD 2.51/kg) and 2023 (USD 2.64/kg).
Global Headwinds
Market conditions remain volatile due to economic shocks from the Russia–Ukraine conflict and delayed shipments along the Red Sea.
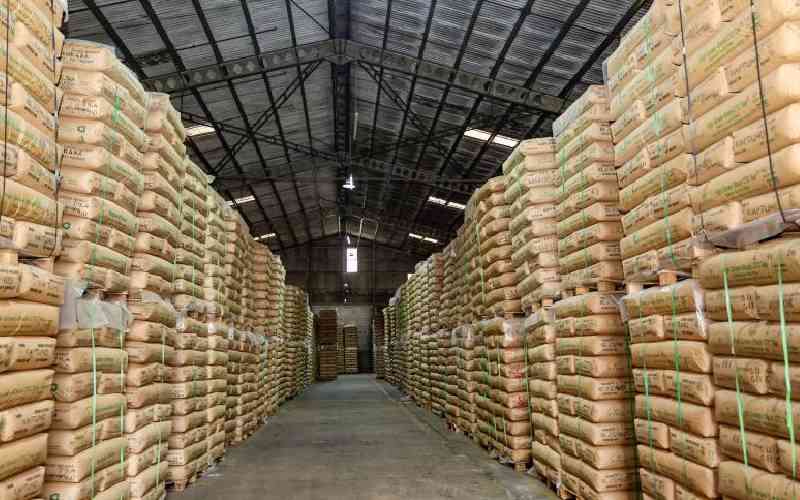
Stockpile Pressure
Higher stock levels in global value chains, stemming from prior years of surplus production, continue to suppress upward price momentum.
Export Trends: Growth in Market Reach, Fall in Volume
Export Trends: Growth in Market Reach, Fall in Volume Kenya exported 42.34 million kilograms of tea in February 2025, marking an 11.45 million kilogram decline compared to February 2024 (53.80 million kg), and a drop from January 2025’s 47.21 million kg. Despite the lower volumes, the number of export destinations rose from 53 to 58, signaling growing diversification. Pakistan remained the dominant buyer, accounting for 34.9% of all exports with 14.77 million kilograms. Other key markets included Egypt, UK, Sudan, Russia, and India, all of which absorbed significant volumes. Encouragingly, emerging markets such as Kazakhstan, Uzbekistan, Bangladesh, and Georgia showed increased activity, reflecting strategic expansion into non-traditional regions. This shift helps Kenya reduce reliance on a handful of large markets, thus mitigating risk.

Editorial Note
This analysis represents expert commentary on economic policy and political developments. All information has been fact-checked and cross-verified from reliable sources. The views expressed are based on professional analysis and independent research.